[](https://www.brendangregg.com/Perf/thread_states.png)
スレッドのパフォーマンス分析における「Off-CPU分析」について、以下のように要約します:
1. 概要と重要性:
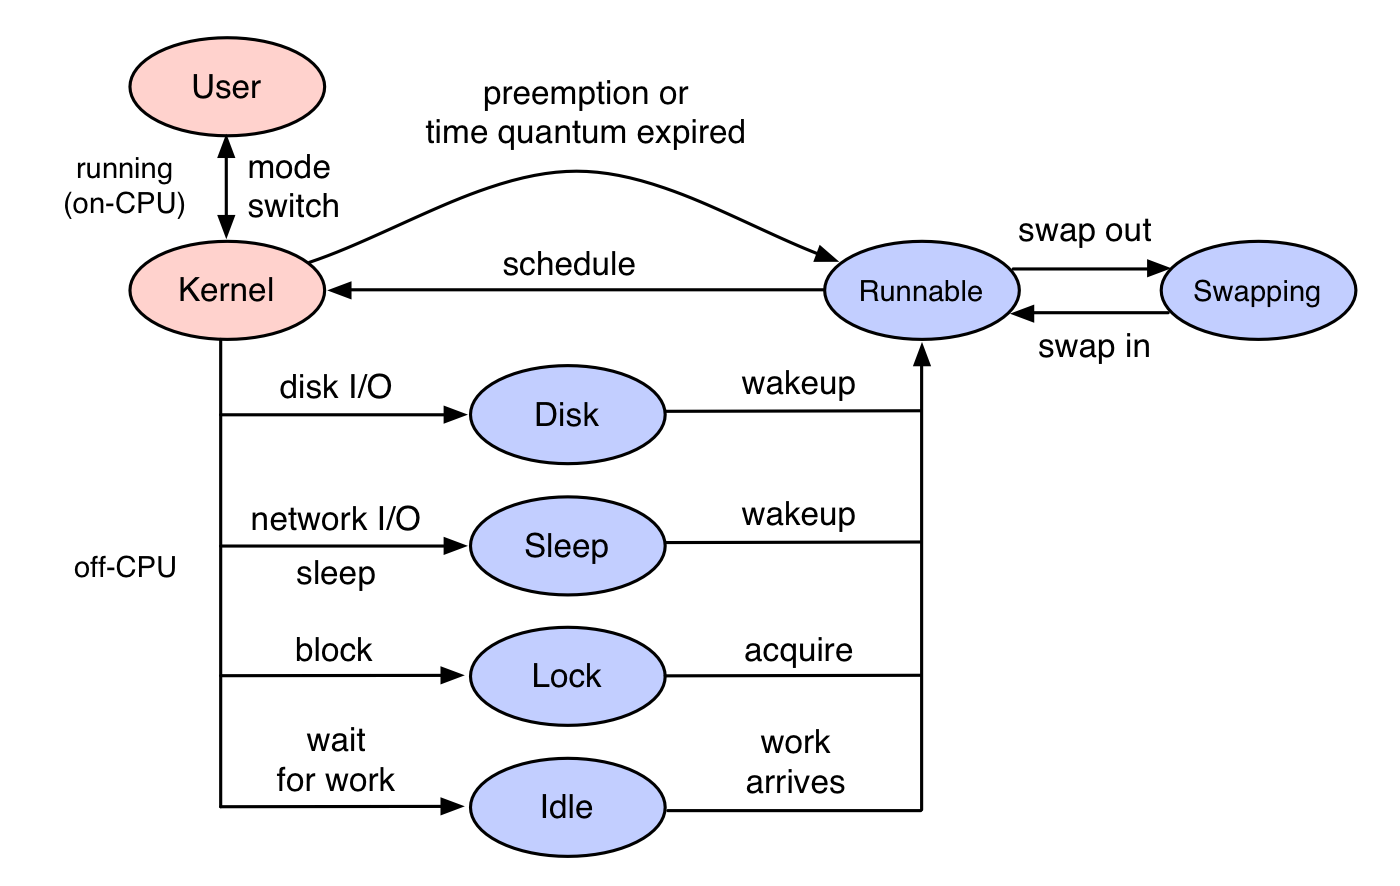
- Off-CPU分析とは、スレッドがCPUでの実行を停止し待機している時間を分析する手法
- ブロッキングI/O、ロック、タイマー、ページングなどによる待機時間を対象とする
- CPU上での実行時間(On-CPU)分析と組み合わせることで、スレッドの全実行時間を把握可能
2. 主な特徴:
- カーネルスケジューラのブロッキング概念に基づいて分析を行う
- スレッドがOff-CPUの間はスタックトレースが変化しないため、ブロッキング開始または終了時点の1回のスタック取得で分析可能
- すべての待機イベントを単一の手法で分析できる
1. 実装手法:
- Linux環境ではeBPFやperfなどのツールを使用可能
- eBPFはカーネル内でスタックトレースと時間を集計できるため効率的
- 最新のLinuxカーネル(4.8以降)でスタックトレースのサポートが必要
2. 注意点:
- スケジューライベントは非常に頻繁に発生する可能性があり、オーバーヘッドに注意が必要
- スタックトレースを取得するにはフレームポインタの有効化などの前提条件が必要
- CPU飽和時の非自発的コンテキストスイッチにも注意が必要
3. 可視化:
- Flame Graphsを使用することで、数百ページに及ぶスタックトレース出力を視覚的に理解可能
- ブロッキングパスの全体像を把握しやすい
この手法は、パフォーマンス問題の特定とデバッグに非常に有用なツールとなります。
For more on off-CPU analysis, see the visualizations in [Off-CPU Flame Graphs](https://www.brendangregg.com/FlameGraphs/offcpuflamegraphs.html) and [Hot/Cold Flame Graphs](https://www.brendangregg.com/FlameGraphs/hotcoldflamegraphs.html).
## Updates
My first post on off-CPU analysis was in 2007: [DTracing Off-CPU Time](http://www.brendangregg.com/blog/2007-07-29/dtracing-off-cpu-time.html).
Updates from 2012:
- I included off-CPU analysis as a part of a Stack Profile Method in my [USENIX LISA 2012](https://www.slideshare.net/brendangregg/lisa12-methodologies/121) talk. The Stack Profile Method is the technique of collecting both CPU and off-CPU stacks, to study all the time spent by threads.
Updates from 2013:
- Yichun Zhang created off-CPU flame graphs using SystemTap and gave the talk [Introduction to off CPU Time Flame Graphs (PDF)](http://agentzh.org/misc/slides/off-cpu-flame-graphs.pdf).
- I included off-CPU flame graphs in my USENIX LISA 2013 talk [Blazing Performance with Flame Graphs](http://www.brendangregg.com/blog/2017-04-23/usenix-lisa-2013-flame-graphs.html).
Updates from 2015:
- I posted [FreeBSD Off-CPU Flame Graphs](http://www.brendangregg.com/blog/2015-03-12/freebsd-offcpu-flame-graphs.html) to explore the procstat -ka off-CPU sampling approach.
- I posted [Linux perf\_events Off-CPU Time Flame Graph](http://www.brendangregg.com/blog/2015-02-26/linux-perf-off-cpu-flame-graph.html) to show how these could be created with perf event logging – if all you had was perf (use eBPF instead).
Updates from 2016:
- I posted [Linux eBPF Off-CPU Flame Graph](http://www.brendangregg.com/blog/2016-01-20/ebpf-offcpu-flame-graph.html) to show the value of this and help make the case for stack traces in eBPF (I had to hack them in for this proof of concept).
- I posted [Linux Wakeup and Off-Wake Profiling](http://www.brendangregg.com/blog/2016-02-01/linux-wakeup-offwake-profiling.html) to show wakeup stack analysis.
- I posted [Who is waking the waker? (Linux chain graph prototype](http://www.brendangregg.com/blog/2016-02-05/ebpf-chaingraph-prototype.html) as a proof of concept of walking a chain of wakeups.
- I described the importance of off-CPU analysis at the start of my Facebook Performance@Scale talk: [Linux BPF Superpowers](https://www.facebook.com/atscaleevents/videos/1693888610884236/) ([slides](http://www.slideshare.net/brendangregg/linux-bpf-superpowers)).
Updates from 2017:
- I used a few off-CPU flame graphs in my [Linux Load Averages: Solving the Mystery](http://www.brendangregg.com/blog/2017-08-08/linux-load-averages.html) post.
- I summarized off-CPU, wakeup, off-wake, and chain graphs in my USENIX ATC 2017 talk on Flame Graphs: [youtube](https://youtu.be/D53T1Ejig1Q?t=50m16s), [slides](https://www.slideshare.net/brendangregg/usenix-atc-2017-visualizing-performance-with-flame-graphs/54).