[[notes/system-engineering/Lustre]]のモニタリングガイド。
## Introduction
There are a variety of useful statistics and counters available on Lustre servers and clients. This is an attempt to detail some of these statistics and methods for collecting and working with them.
This does not include Lustre log analysis.
The presumed audience for this is system administrators attempting to better understand and monitor their Lustre file systems.
### Adding to This Guide
If you have improvements, corrections, or more information to share on this topic please contribute to this page. Ideally this would become a community resource.
## Lustre Versions
This information was originally based on working with Lustre 2.4 and 2.5. The same metrics are available in 2.10.
## Reading /proc vs lctl
'cat /proc/fs/lustre...' vs 'lctl get\_param'
With newer Lustre versions, 'lctl get\_param' is the standard and recommended way to get these stats. This is to insure portability. I will use this method in all examples, a bonus is it can be often be a little shorter syntax.
## Data Formats
Format of the various statistics type files varies (and I'm not sure if there is any reason for this). The format names here are entirely \*my invention\*, this isn't a standard for Lustre or anything.
It is useful to know the various formats of these files so you can parse the data and collect for use in other tools.
### Stats
What I consider a "standard" stats files include for example each OST or MDT as a multi-line record, and then just the data.
Example:
```
obdfilter.scratch-OST0001.stats=
snapshot_time 1409777887.590578 secs.usecs
read_bytes 27846475 samples [bytes] 4096 1048576 14421705314304
write_bytes 16230483 samples [bytes] 1 1048576 14761109479164
get_info 3735777 samples [reqs]
```
The basic format of each line of the **stats** files is:
{name of statistic} {count of events} samples \[{units}\]
Some statistics also contain min/max/*average* values:
{name of statistic} {count of events} samples \[{units}\] {minimum value} {maximum value} {sum of values}
The average (mean value) value can be computed from {sum of values}/{count of events} since it isn't possible to do floating-point math in the kernel.
Some statistics also contain *standard deviation* data:
{name of statistic} {count of events} samples \[{units}\] {minimum value} {maximum value} {sum of values} {sum of value squared}
The standard deviation can be computed from sqrt({sum of values squared} - {mean value}²).
snapshot\_time = when the stats were written
For read\_bytes and write\_bytes:
- First number = number of times (samples) the OST has handled a read or write.
- Second number = the minimum read/write size
- Third number = maximum read/write size
- Fourth = sum of all the read/write requests in bytes, the quantity of data read/written.
### Jobstats
Jobstats are slightly more complex multi-line records. They are formatted in YAML, which looks like JSON, except for the (-) blocks for each job. Each OST or MDT also has an entry for each jobid (or procname\_uid perhaps), and then the data.
Example:
```
obdfilter.scratch-OST0000.job_stats=job_stats:
- job_id: 56744
snapshot_time: 1409778251
read: { samples: 18722, unit: bytes, min: 4096, max: 1048576, sum: 17105657856 }
write: { samples: 478, unit: bytes, min: 1238, max: 1048576, sum: 412545938 }
setattr: { samples: 0, unit: reqs } punch: { samples: 95, unit: reqs }
- job_id: . . . ETC
```
Notice this is very similar to 'stats' above.
### Single
These really boil down to just a single number in a file. But if you use "lctl get\_param" you get an output that is nice for parsing. For example:
```
[COMMAND LINE]# lctl get_param osd-ldiskfs.*OST*.kbytesavail
osd-ldiskfs.scratch-OST0000.kbytesavail=10563714384
osd-ldiskfs.scratch-OST0001.kbytesavail=10457322540
osd-ldiskfs.scratch-OST0002.kbytesavail=10585374532
```
### Histogram
Some stats are histograms, these types aren't covered here. Typically they're useful on their own without further parsing(?)
- brw\_stats
- extent\_stats
## Interesting Statistics Files
This is a collection of various stats files that I have found useful. It is \*not\* complete or exhaustive. For example, you will noticed these are mostly server stats. There are a wealth of client stats too not detailed here. Additions or corrections are welcome.
- Host Type = MDS, OSS, client
- Target = "lctl get\_param target"
- Format = data format discussed above
| Host Type | Target | Format | Discussion |
| --- | --- | --- | --- |
| MDS | mdt.\*MDT\*.num\_exports | single | number of exports per MDT - these are clients, including other lustre servers |
| MDS | mdt.\*.job\_stats | jobstats | Metadata jobstats. Note that with lustre DNE you may have more than one MDT, so even if you don't it may be wise to design any tools with that assumption. |
| OSS | obdfilter.\*.job\_stats | jobstats | the per OST jobstats. |
| MDS | mdt.\*.md\_stats | stats | Overall metadata stats per MDT |
| MDS | mdt.\*MDT\*.exports.\*@\*.stats | stats | Per-export metadata stats. The exports subdirectory lists client connections by NID. The exports are named by interfaces, which can be unweildy. See "lltop" for an example of a script that used this data well. The sum of all the export stats should provide the same data as md\_stats, but it is still very convenient to have md\_stats, "ltop" uses them for example. |
| OSS | obdfilter.\*.stats | stats | Operations per OST. Read and write data is particularly interesting |
| OSS | obdfilter.\*OST\*.exports.\*@\*.stats | stats | per-export OSS statistics |
| MDS | osd-\*.\*MDT\*.filesfree or filestotal | single | available or total inodes |
| MDS | osd-\*.\*MDT\*.kbytesfree or kbytestotal | single | available or total disk space |
| OSS | obdfilter.\*OST\*.kbytesfree or kbytestotal, filesfree, filestotal | single | inodes and disk space as in MDS version |
| OSS | ldlm.namespaces.filter-\*.pool.stats | stats? but unsure of all fields meaning | lustre distributed lock manager (ldlm) stats. I do not fully understand these stats or the format. It also appears that these same stats are duplicated a single stats. My understanding of these stats comes from [http://wiki.old.lustre.org/doxygen/HEAD/api/html/ldlm\_\_pool\_8c\_source.html](http://wiki.old.lustre.org/doxygen/HEAD/api/html/ldlm__pool_8c_source.html) |
| OSS | ldlm.namespaces.filter-\*.lock\_count | single | number of locks |
| OSS | ldlm.namespaces.filter-\*.pool.granted | single | lustre distributed lock manager (ldlm) granted locks |
| OSS | ldlm.namespaces.filter-\*.pool.grant\_rate | single | ldlm lock grant rate aka 'GR' |
| OSS | ldlm.namespaces.filter-\*.pool.cancel\_rate | single | ldlm lock cancel rate aka 'CR' |
| OSS | ldlm.namespaces.filter-\*.pool.grant\_speed | single | ldlm lock grant speed = grant\_rate - cancel\_rate. You can use this to derive cancel\_rate 'CR'. Or you can just get 'CR' from the stats file I assume. |
## Working With the Data
Packages, tools, and techniques for working with Lustre statistics.
### Open Source Monitoring Packages
- LMT - provides 'top' style monitoring of server nodes, and historical data via mysql. [https://github.com/chaos/lmt](https://github.com/chaos/lmt)
- lltop and xltop - monitoring with batch scheduler integration. Newer Lustre versions with jobstats likely provide similar data very conveniently, but these are still very good for examples of working with monitoring data. [https://github.com/jhammond/lltop](https://github.com/jhammond/lltop) [https://github.com/jhammond/xltop](https://github.com/jhammond/xltop)
- Integrated Manager for Lustre - With version 4.0, IML is FOSS software. This can be installed in a monitoring only mode. [https://github.com/whamcloud/integrated-manager-for-lustre](https://github.com/whamcloud/integrated-manager-for-lustre)
### Build it Yourself
Here are basic steps and techniques for working with the Lustre statistics.
1. **Gather** the data on hosts you are monitoring. Deal with the syntax, extract what you want
2. **Collect** the data centrally - either pull or push it to your server, or collection of monitoring servers.
3. **Process** the data - this may be optional or minimal.
4. **Alert** on the data - optional but often useful.
5. **Present** the data - allow for visualization, analysis, etc.
Some recent tools for working with metrics and time series data have made some of the more difficult parts of this task relatively easy, especially graphical presentation.
Here are details of some solutions tested or in use:
#### Ganglia
1. Via Collectl
1. **Old collectl method**
- collectl - does the **gather** by writing to a text file on the host being monitored
- ganglia does the **collect** via gmond and python script 'collectl.py' and **present** via ganglia web pages - there is no alerting.
- See [https://wiki.rocksclusters.org/wiki/index.php/Roy\_Dragseth#Integrating\_collectl\_and\_ganglia](https://wiki.rocksclusters.org/wiki/index.php/Roy_Dragseth#Integrating_collectl_and_ganglia)
2. Newer **collectl plugin** from [https://github.com/pcpiela/collectl-lustre](https://github.com/pcpiela/collectl-lustre) - Note there have recently been some changes, after collectl-3.7.3 Lustre support in collectl is moving to plugins: [http://sourceforge.net/p/collectl/mailman/message/31992463](http://sourceforge.net/p/collectl/mailman/message/31992463)
2. Via Ganglia python plugin
- A **ganglia plugin** [gmond python module](https://github.com/ganglia/gmond_python_modules) for monitoring lustre client is available via [ganglia github project](https://github.com/ganglia)
#### Perl and Graphite
Graphite is a very convenient tool for storing, working with, and rendering graphs of time-series data. At SSEC we did a quick prototype for collecting and sending MDS and OSS data using perl. The choice of perl is not particularly important, python or the tool of your choice is fine.
Software Used:
- Graphite and Carbon - [http://graphite.readthedocs.org/en/latest/](http://graphite.readthedocs.org/en/latest/)
- [http://www.ssec.wisc.edu/~scottn/files/Lustrestats.pm](http://www.ssec.wisc.edu/~scottn/files/Lustrestats.pm) - perl module to parse different types of lustre stats, used by lustrestats scripts
- lustrestats scripts - these are simply run every minute via cron on the servers you monitor. For the SSEC prototype we simply sent text data via a TCP socket. The check\_mk scripts in the next section have replaced these original test scripts.
- Grafana - [http://grafana.org](http://grafana.org/) - this is a dashboard and graph editor for graphite. It is not required, as graphite can be used directly, but is very convenient. I allows for not just ease of creating dashboards, but also encoruages rapid interactive analysis of the data. Note that elasticsearch can be used to store dashboards for grafana, but is not required.
#### check\_mk and Graphite
Another option is instead of directly sending with perl, use a check\_mk local agent check.
The local agent and pnp4nagios mean a reasonable infrastructure is already in place for alerting and also collecting performance data.
While collecting via perl allowed us to send the timestamp from the Lustre stats (when they exist) directly to Carbon, Graphite's data collection tool. When using the check\_mk method this timestamp is lost, so timestamps are then based on when the local agent check runs. This will introduce some inaccuracy - a delay of up to your sample rate.
Collecting via both methods allows you to see this difference. This graph shows all the "export" stats summed for each method, with derivative applied to create a rate of change. "CMK" is the check\_mk data and "timestamped" was from the perl script. Plotting the raw counter data of course shows very little, but with this derived data you can see the difference.
This data was sampled once per minute:
[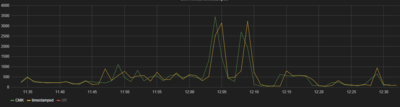](https://wiki.lustre.org/File:Timestamp_graphite_jitter.PNG)
For our uses at SSEC, this was acceptable. Sampling much more frequently will of course make the error smaller.
- Graphite - [http://graphite.readthedocs.org/en/latest/](http://graphite.readthedocs.org/en/latest/)
- [http://www.ssec.wisc.edu/~scottn/files/Lustrestats.pm](http://www.ssec.wisc.edu/~scottn/files/Lustrestats.pm) - perl module to parse different types of lustre stats, used by lustrestats scripts
- OMD - check\_mk, nagios, pnp4nagios
- check\_mk local scripts - these are called via check\_mk, at whatever rate is desired. [http://www.ssec.wisc.edu/~scottn/files/lustre\_stats\_mds.cmk](http://www.ssec.wisc.edu/~scottn/files/lustre_stats_mds.cmk) [http://www.ssec.wisc.edu/~scottn/files/lustre\_stats\_oss.cmk](http://www.ssec.wisc.edu/~scottn/files/lustre_stats_oss.cmk)
- graphios [https://github.com/shawn-sterling/graphios](https://github.com/shawn-sterling/graphios) - a python script to send your nagios performance data to graphite
- Grafana - [http://grafana.org](http://grafana.org/) - not required, but convenient for dashboards.
**Grafana Lustre Dashboard Screenshots:**
[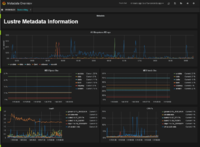](https://wiki.lustre.org/File:Meta-oveview.PNG "Metadata for multiple file systems.") [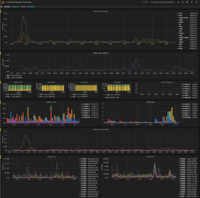](https://wiki.lustre.org/File:Fs-dashboard.PNG "Dashboard for a lustre file system.")
#### Logstash, python, and Graphite
Brock Palen discusses this method: [http://www.failureasaservice.com/2014/10/lustre-stats-with-graphite-and-logstash.html](http://www.failureasaservice.com/2014/10/lustre-stats-with-graphite-and-logstash.html)
#### Collectd plugin and Graphite
This talk mentions a custom collectd plugin to send stats to graphite: [http://www.opensfs.org/wp-content/uploads/2014/04/D3\_S31\_FineGrainedFileSystemMonitoringwithLustreJobstat.pdf](http://www.opensfs.org/wp-content/uploads/2014/04/D3_S31_FineGrainedFileSystemMonitoringwithLustreJobstat.pdf)
Unsure if the source for that plugin is available.
#### Prometheus Exporters
- [https://github.com/HewlettPackard/lustre\_exporter](https://github.com/HewlettPackard/lustre_exporter) - this appears inactive (10/2022)
- [https://github.com/GSI-HPC/lustre\_exporter](https://github.com/GSI-HPC/lustre_exporter) - branch of HP exporter, more recent changes
- [https://github.com/whamcloud/lustrefs-exporter](https://github.com/whamcloud/lustrefs-exporter) - reinventing things with Rust instead of Go?
#### A Note about Jobstats
If using a whisper or RRD-file based solution, jobstats may not be a great fit. The strength of RRD or Whisper files are you have a set size for each metric collected. If your metrics are now per-job as opposed to only per-export or per-server, this means your *number of metrics* is now growing without bound.
Solutions anyone?
#### Jobstats: Finding jobs doing I/O over watermark
The `lljobstat` script can be used to collect and filter current output created by jobstats from the local Lustre targets. It shows the jobs doing the most RPCs on the current server, and is useful for quickly debugging the source of a high IO/RPC load on a server, similar to `top`. This is included in Lustre 2.16.0 and later, but is a standalone Python script and could be copied to older installations as needed.
A more advanced version of `lljobstat` is `glljobstat`, the [Global Lustre Jobstats utility](https://github.com/DDNeu/global-lustre-jobstats). This allows monitoring the job stats from all of the servers, but needs a more complex configuration to run.
#### Jobstats: A lightweight solution to provide I/O statistics to users
The second part of Roland Laifer's talk at LAD'15 (see references) described a lightweight solution to provide I/O statistics to users. When a batch job is submitted a user can request statistics for dedicated Lustre file systems. After job completion the batch system writes files which include job ID, file system name, user name and email address. For each file system, a cron job on one server uses these files, collects jobstats from all servers and sends an email with I/O statistics to the user. You can download scripts (which require few modifications) and a detailed description here: [https://www.scc.kit.edu/scc/sw/lustre\_tools/jobstats2email.tgz](https://www.scc.kit.edu/scc/sw/lustre_tools/jobstats2email.tgz)
Note that array jobs are not well tested and might cause problems. For example, job IDs might get forged or a single job array could initiate thousands of emails. Therefore, it might be a good idea to send no emails for array jobs: The batch system could just create no input files if job arrays are used.
## References and Links
- [http://cdn.opensfs.org/wp-content/uploads/2015/04/Lustre-Metrics-New-Techniques-for-Monitoring\_Nolin\_Wagner.pdf](http://cdn.opensfs.org/wp-content/uploads/2015/04/Lustre-Metrics-New-Techniques-for-Monitoring_Nolin_Wagner.pdf)
- Daniel Kobras, "Lustre - Finding the Lustre Filesystem Bottleneck", LAD2012. [http://www.eofs.eu/fileadmin/lad2012/06\_Daniel\_Kobras\_S\_C\_Lustre\_FS\_Bottleneck.pdf](http://www.eofs.eu/fileadmin/lad2012/06_Daniel_Kobras_S_C_Lustre_FS_Bottleneck.pdf)
- Florent Thery, "Centralized Lustre Monitoring on Bull Platforms", LAD2013. [http://www.eofs.eu/fileadmin/lad2013/slides/11\_Florent\_Thery\_LAD2013-lustre-bull-monitoring.pdf](http://www.eofs.eu/fileadmin/lad2013/slides/11_Florent_Thery_LAD2013-lustre-bull-monitoring.pdf)
- Daniel Rodwell and Patrick Fitzhenry, "Fine-Grained File System Monitoring with Lustre Jobstat", LUG2014. [http://www.opensfs.org/wp-content/uploads/2014/04/D3\_S31\_FineGrainedFileSystemMonitoringwithLustreJobstat.pdf](http://www.opensfs.org/wp-content/uploads/2014/04/D3_S31_FineGrainedFileSystemMonitoringwithLustreJobstat.pdf)
- Gabriele Paciucci and Andrew Uselton, "Monitoring the Lustre\* file system to maintain optimal performance", LAD2013. [http://www.eofs.eu/fileadmin/lad2013/slides/15\_Gabriele\_Paciucci\_LAD13\_Monitoring\_05.pdf](http://www.eofs.eu/fileadmin/lad2013/slides/15_Gabriele_Paciucci_LAD13_Monitoring_05.pdf)
- Christopher Morrone, "LMT Lustre Monitoring Tools", LUG2011. [http://cdn.opensfs.org/wp-content/uploads/2012/12/400-430\_Chris\_Morrone\_LMT\_v2.pdf](http://cdn.opensfs.org/wp-content/uploads/2012/12/400-430_Chris_Morrone_LMT_v2.pdf)
- Roland Laifer, "Lustre tools for ldiskfs investigation and lightweight I/O statistics", LAD2015. [http://www.eofs.eu/fileadmin/lad2015/slides/13\_Roland\_Laifer\_kit\_20150922.pdf](http://www.eofs.eu/fileadmin/lad2015/slides/13_Roland_Laifer_kit_20150922.pdf)
- Lustre and associated scripts used by SSEC - [http://www.ssec.wisc.edu/~scottn/files/](http://www.ssec.wisc.edu/~scottn/files/)
- [https://github.com/jhammond/lltop](https://github.com/jhammond/lltop)
- [https://github.com/chaos/lmt](https://github.com/chaos/lmt)
- [https://github.com/chaos/cerebro](https://github.com/chaos/cerebro)
- [http://graphite.readthedocs.org/en/latest/](http://graphite.readthedocs.org/en/latest/)
- [https://mathias-kettner.de/check\_mk](https://mathias-kettner.de/check_mk)
- [https://github.com/shawn-sterling/graphios](https://github.com/shawn-sterling/graphios)